


Traffic fatalities provide the clearest measure of roadway safety because they represent the most severe crash outcomes and are less volatile than total crash counts. Minor property-damage incidents can fluctuate due to reporting patterns or traffic volume shifts, but fatality totals typically reflect broader structural conditions across the transportation system. Looking across a five-year window allows for evaluation of whether Michigan is experiencing directional change or annual movement within a stable range.
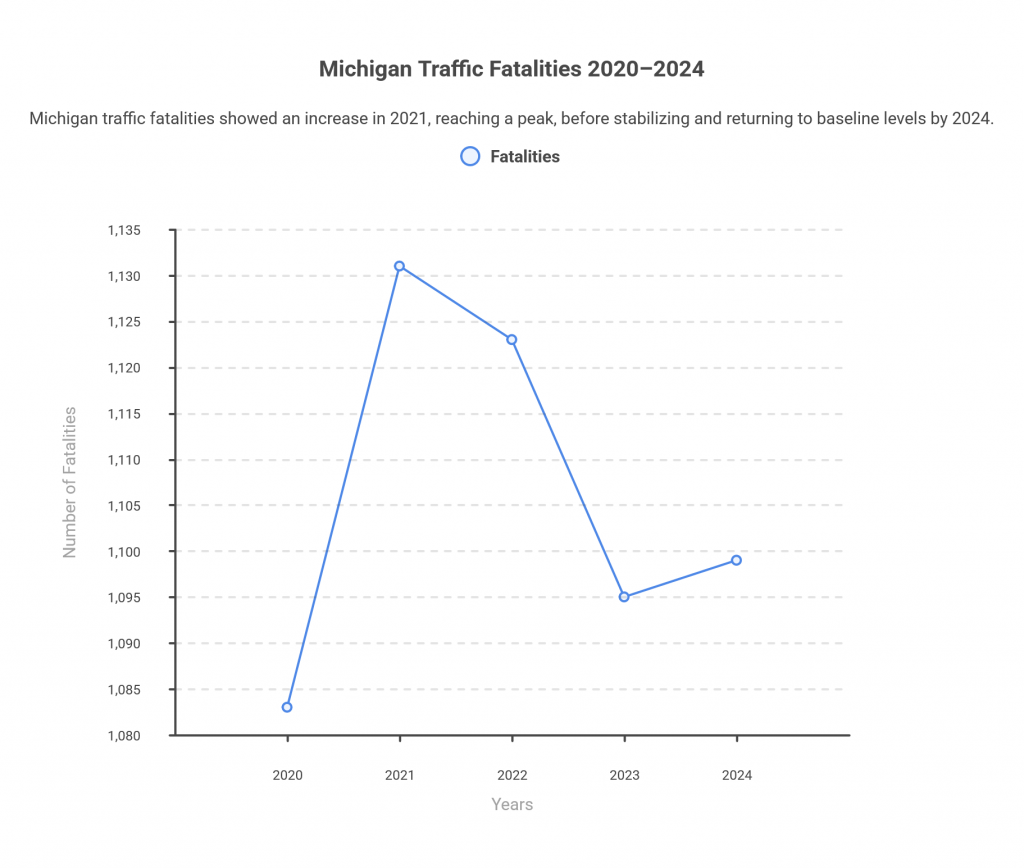
The statewide fatality totals from 2020 through 2024 are shown below:
Total Fatalities by Year
| Year | Fatalities |
| 2020 | 1,083 |
| 2021 | 1,131 |
| 2022 | 1,123 |
| 2023 | 1,095 |
| 2024 | 1,099 |
Across five years, Michigan recorded 5,531 traffic deaths, with an annual average of 1,106. The difference between the highest and lowest year was 48 fatalities. In a statewide context involving millions of residents and extensive annual vehicle miles traveled, this range reflects measurable fluctuation but not dramatic structural swings.
Evaluating the 2021 Increase
The most noticeable shift occurred between 2020 and 2021, when fatalities increased by 48 deaths.
| Year | Fatalities | Change | Percent Change |
| 2020 | 1,083 | — | — |
| 2021 | 1,131 | +48 | +4.4% |
| 2022 | 1,123 | -8 | -0.7% |
| 2023 | 1,095 | -28 | -2.5% |
| 2024 | 1,099 | +4 | +0.4% |
The 4.4 percent rise in 2021 stands out as the largest year-over-year movement in the five-year period. What matters analytically is what followed. Fatalities declined modestly in 2022 and again in 2023 before stabilizing in 2024. The absence of continued upward movement suggests that the 2021 peak represents a short-term deviation rather than the beginning of sustained escalation.
From a trend perspective, the data reflects volatility within a defined band rather than directional acceleration.
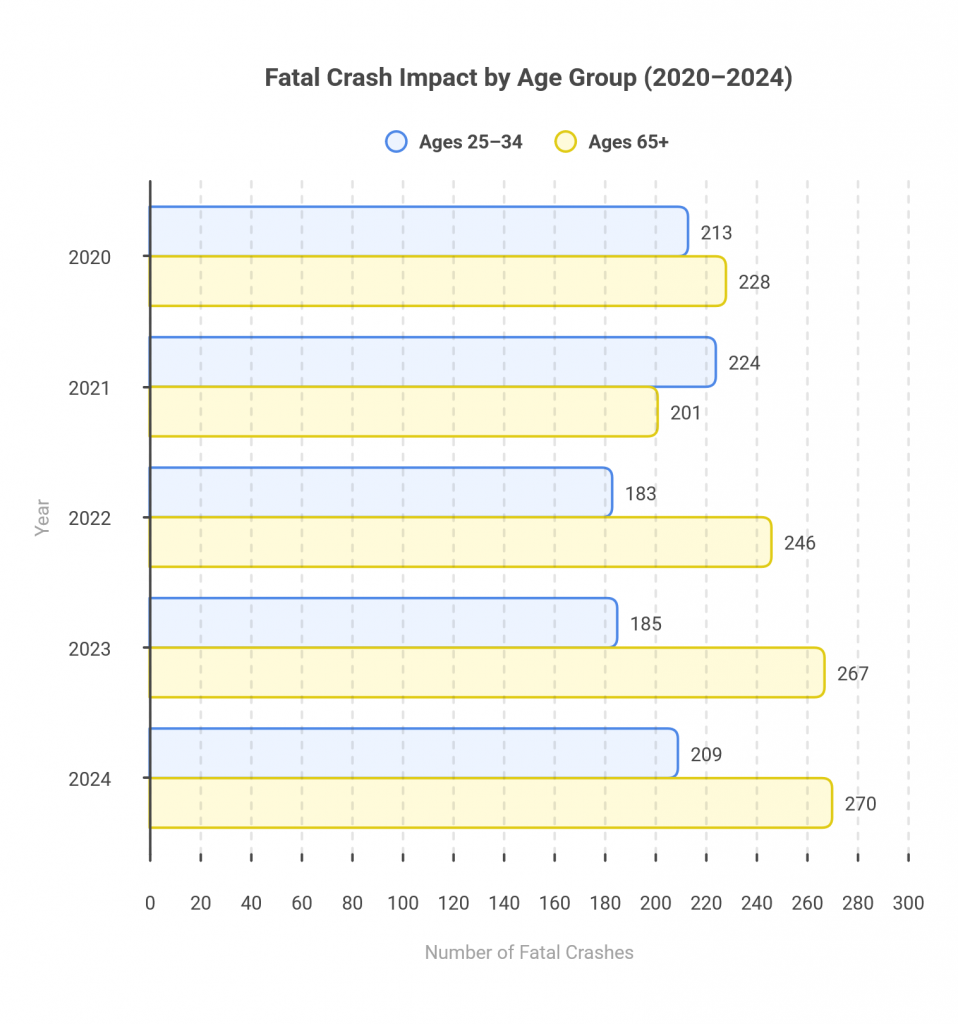
Age Distribution Patterns
Fatal outcomes are not evenly distributed across age groups. The 25 to 34 age range recorded the highest fatality totals in each of the five years analyzed
| 2020 | 213 |
| 2021 | 224 |
| 2022 | 183 |
| 2023 | 185 |
| 2024 | 209 |
This recurring concentration indicates that working-age adults account for a significant share of fatal crash impact. Exposure levels, commuting patterns, and travel frequency likely contribute to this distribution. Individuals within this demographic often log higher annual mileage and may be more active during peak traffic hours.
At the same time, fatality totals among drivers aged 65 and older remain substantial across the period, reflecting increased physical vulnerability and demographic shifts within the state’s population. The data therefore suggests that fatal crash impact reflects both exposure intensity and susceptibility.
Seasonal Timing of Fatalities
Fatality counts are not evenly distributed throughout the calendar year. The 2024 monthly breakdown shows that several months accounted for a higher percentage of deaths relative to their share of miles driven.
The months with elevated fatality share compared to exposure were:
- January
- May
- August
- September
- October
- November
- December
When the percentage of deaths exceeds the percentage of miles traveled, it indicates that risk intensity varies seasonally. Weather conditions, daylight duration, holiday travel, construction activity, and traffic composition may all influence this imbalance. The divergence suggests that exposure alone does not fully explain fatality timing patterns.
Five-Year Interpretation
Between 2020 and 2024, Michigan traffic fatalities fluctuated within a constrained range near 1,100 deaths per year. The 2021 peak represents the most significant deviation during the period, but subsequent moderation indicates stabilization rather than sustained growth.
Viewed collectively, the data reflects short-term variability within a relatively consistent baseline. Whether this five-year period represents a plateau in statewide roadway safety outcomes or part of a longer-term cycle will require continued monitoring beyond 2024.
Key Observations
- Annual traffic fatalities in Michigan remained within a narrow range between 1,083 and 1,131 deaths from 2020 through 2024 Historical_5year.
- The largest year-over-year increase occurred between 2020 and 2021, but subsequent years did not sustain that upward movement.
- Individuals aged 25 to 34 consistently recorded the highest fatality totals during the five-year period.
- Several 2024 months recorded a higher share of deaths than their share of miles driven, indicating seasonal variation in fatality intensity.